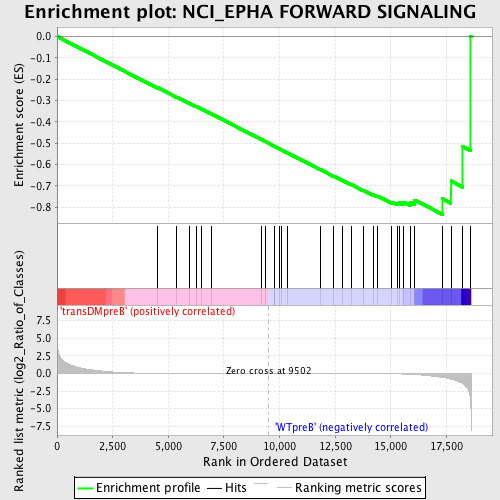
Profile of the Running ES Score & Positions of GeneSet Members on the Rank Ordered List
| Dataset | Set_04_transDMpreB_versus_WTpreB.phenotype_transDMpreB_versus_WTpreB.cls #transDMpreB_versus_WTpreB |
| Phenotype | phenotype_transDMpreB_versus_WTpreB.cls#transDMpreB_versus_WTpreB |
| Upregulated in class | WTpreB |
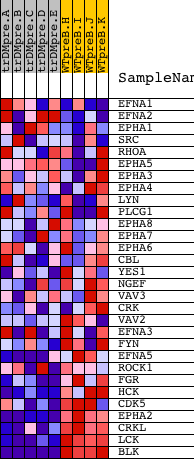
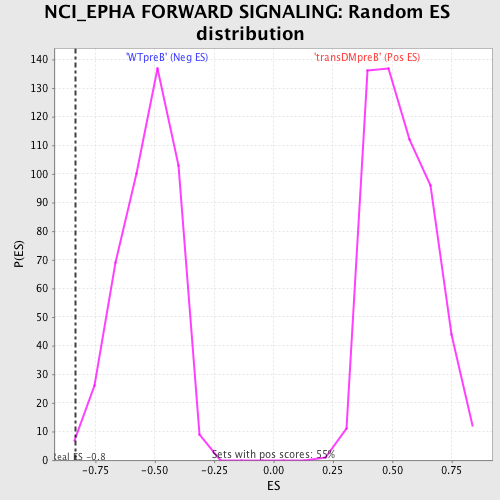
| GeneSet | NCI_EPHA FORWARD SIGNALING |
| Enrichment Score (ES) | -0.8346654 |
| Normalized Enrichment Score (NES) | -1.5712416 |
| Nominal p-value | 0.0022172949 |
| FDR q-value | 0.10737558 |
| FWER p-Value | 0.662 |
| PROBE | DESCRIPTION (from dataset) | GENE SYMBOL | GENE_TITLE | RANK IN GENE LIST | RANK METRIC SCORE | RUNNING ES | CORE ENRICHMENT | |
|---|---|---|---|---|---|---|---|---|
| 1 | EFNA1 | 15279 | 4508 | 0.026 | -0.2392 | No | ||
| 2 | EFNA2 | 8883 | 5380 | 0.015 | -0.2841 | No | ||
| 3 | EPHA1 | 17168 8908 17167 | 5942 | 0.011 | -0.3128 | No | ||
| 4 | SRC | 5507 | 6276 | 0.009 | -0.3295 | No | ||
| 5 | RHOA | 8624 4409 4410 | 6499 | 0.009 | -0.3403 | No | ||
| 6 | EPHA5 | 16498 | 6929 | 0.007 | -0.3625 | No | ||
| 7 | EPHA3 | 22563 1643 | 9182 | 0.001 | -0.4835 | No | ||
| 8 | EPHA4 | 4673 | 9346 | 0.000 | -0.4922 | No | ||
| 9 | LYN | 16281 | 9749 | -0.001 | -0.5138 | No | ||
| 10 | PLCG1 | 14753 | 9774 | -0.001 | -0.5150 | No | ||
| 11 | EPHA8 | 15705 | 9983 | -0.001 | -0.5260 | No | ||
| 12 | EPHA7 | 8909 4674 | 10087 | -0.002 | -0.5313 | No | ||
| 13 | EPHA6 | 22564 | 10355 | -0.002 | -0.5454 | No | ||
| 14 | CBL | 19154 | 11840 | -0.006 | -0.6244 | No | ||
| 15 | YES1 | 5930 | 12438 | -0.009 | -0.6554 | No | ||
| 16 | NGEF | 13891 | 12811 | -0.011 | -0.6740 | No | ||
| 17 | VAV3 | 1774 1848 15443 | 13227 | -0.013 | -0.6946 | No | ||
| 18 | CRK | 4559 1249 | 13772 | -0.019 | -0.7214 | No | ||
| 19 | VAV2 | 5848 2670 | 14223 | -0.025 | -0.7423 | No | ||
| 20 | EFNA3 | 15278 | 14415 | -0.029 | -0.7488 | No | ||
| 21 | FYN | 3375 3395 20052 | 15046 | -0.049 | -0.7762 | No | ||
| 22 | EFNA5 | 4655 8884 | 15286 | -0.061 | -0.7811 | Yes | ||
| 23 | ROCK1 | 5386 | 15375 | -0.067 | -0.7770 | Yes | ||
| 24 | FGR | 4723 | 15575 | -0.084 | -0.7767 | Yes | ||
| 25 | HCK | 14787 | 15902 | -0.120 | -0.7785 | Yes | ||
| 26 | CDK5 | 16591 | 16077 | -0.157 | -0.7673 | Yes | ||
| 27 | EPHA2 | 16006 | 17330 | -0.562 | -0.7611 | Yes | ||
| 28 | CRKL | 4560 | 17704 | -0.794 | -0.6773 | Yes | ||
| 29 | LCK | 15746 | 18240 | -1.451 | -0.5160 | Yes | ||
| 30 | BLK | 3205 21791 | 18586 | -4.095 | 0.0016 | Yes |